Has serious crime really increased?
Winton Centre for Risk and Evidence Communication
News - Has serious crime really increased?
On December 1st a headline in the Daily Mail declared “Revealed, the truth about UK crime: New official figures give more weight to worst offences... and show they're up by almost a fifth”, adding that “The hidden reality of rising violent and sexual crime was exposed yesterday by a new official method of ranking offences by their severity.”
This story was based on the Office for National Statistics’ new ‘Crime Severity Score’, which assigns each police-recorded crime a score reflecting the punishment following a conviction. The “Crime Severity Score data tool” displays the trend for specific police forces: for example Cambridgeshire had a Crime Severity Score of CSS of 8.6 in the year ending March 2016, up from 6.6 three years earlier, a relative increase of 30% after a steadily decline in the preceding decade.
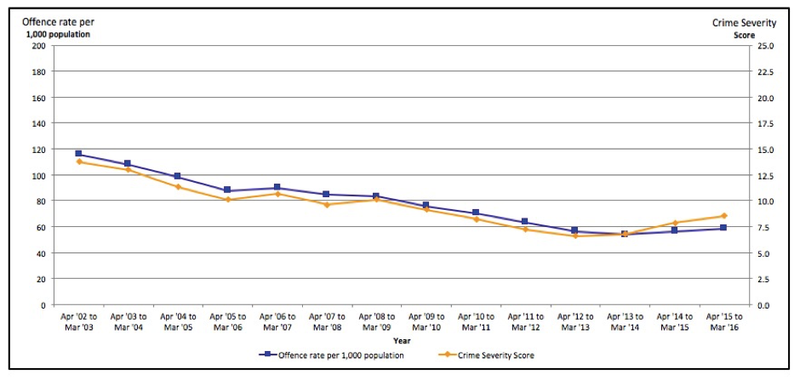
Figure 1: the trend in overall offence rate and Crime Severity Score in Cambridgeshire between 2002 and 2016. Source: ONS Crime Severity Data Tool.
This sharp increase seems, on the face of it, to support the Daily Mail’s story – the rise in the Crime Severity Score is even greater than the increase in the overall recorded offence rate over the same period, which was around 10%, showing police are recording more severe offences.
The ONS does not think so, saying “The increases in both the rate and Severity Score for most police forces are likely to reflect recent improvements in recording practices, following critical inspections of forces by HMIC published in 2014 which identified that an estimated 1 in 5 offences (19%) that should have been recorded as crimes were not”.
The crucial issue, not mentioned by the Daily Mail or other coverage of this story, is that police-recorded crime are not ‘official’ statistics: they were de-designated as National Statistics in 2014. The Crime Survey for England and Wales (CSEW) is used as the primary source of monitoring crime, and the latest report from this source suggests that both ‘all crime’ and ‘violent crime’ are unchanged from the previous year, except for a ‘small but genuine increase in some categories’.
The Daily Mail’s dramatic story made no mention of being based on data that are not considered reliable enough to be considered official statistics, as they are so susceptible to reporting practices.
The Daily Mail, though, were not alone in mis-reporting this story. There was good coverage by the BBC and Full Fact, but a Times sub-editor managed the absurdly incorrect headline “ Serious crime rate trebles under new way of measuring”, when in fact the article makes clear that it is the increase in crime rate, not the crime rate itself, that is trebled under the new scoring system.
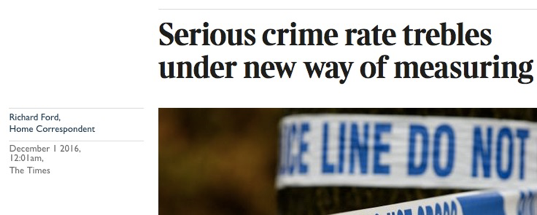
Figure 2: A Times sub-editor does not distinguish between a crime rate and a change in that rate
An Independent sub-editor was just as incompetent, writing a headline claiming that “Violent and serious crime rates triple, according to new Government index”.
But behind all this easily-avoided misreporting, there is something genuinely interesting in these new figures.
How much worse is dangerous driving than shoplifting? How many frauds by company directors are equivalent to a murder? These may seem like moral questions with no possibility of a clear numerical answer, and certainly well outside the expertise of statisticians. But, in a bold innovation, the Office for National Statistics is proposing a ‘Crime Severity Score’ for each type of crime recorded by the police, that allows this sort of comparison. A sample of these scores are shown in the table below.
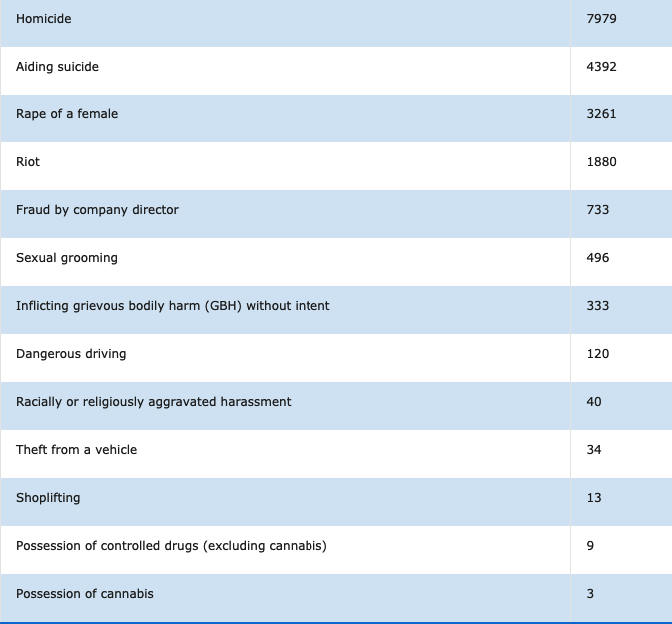
Table 1. A sample of crime severity scores: the full ‘tariff’ can be downloaded from here
So dangerous driving attracts 9 times the score of shop-lifting, and around the score for a homicide is matched by around 10 frauds by company directors, and around 2600 convictions for possession of cannabis.
Each police force assigns a score for every recorded crime, adds up their total score for a year, and this total is divided by the local population to get the average score per resident. For the whole of England and Wales, the average score in the year ending March 2016 was 10.1, with West Yorkshire police scoring highest as 13.6, and Dyfed-Powys lowest with 6.3.
The scores are based on the average number of days’ custodial sentence or community service, or the average number of days necessary to work to pay the fine (assuming income of £88 a day). Rather than a moral scale, the scores therefore represent a rough pragmatic measure of the consequences imposed by society on perpetrators of specific crimes.
The aim is to permit a more fine-grained analysis of changing patterns of reported crime, rather than simply counting crimes or dividing into a few categories, and is partly based on the Cambridge Crime Harm Index.
This new way of measuring crime allows us to do a bit of playing around with the numbers. For example, in 2015/6 there were 54,000,000 residents of England and Wales, and the average score per resident is 10.1, so reported criminal offences had a total score of around 545,000,000, equivalent to 68,000 homicides (at one end of the crime scale) or 180,000,000 convictions for possession of cannabis (to take an example from the other extreme). The average score of 10.1 also means that, from a purely technically perspective, last year the reported crime was equivalent to each resident of England and Wales on average committing an offence attracting a 10-day sentence. But this interpretation would be rather misleading: this ‘average’ is made up of a large majority who score 0, and a minority who get a positive score. This is a fine example of where the average score does not represent the score of an average person – nearly everyone has less than the average score. This is similar to the classic statistical joke about nearly everyone having more than the average number of legs (this being 1.9999…)
The Crime Severity Score appears a bold and innovative idea: if you have opinions about it, the ONS are seeking feedback.
Our suggestion is that the score should be applied to the Crime Survey for England and Wales data, since it is, after all, accepted as the primary source of crime data. This will not be possible at the level of individual police forces, which is the primary concern of the Crime Severity Score. But even if applied at a national level, it could provide some finer calibration of police-recorded crime, with its acknowledged issues of reporting rates.
And in future, perhaps the ONS might be bolder in stating the limitations of police-recorded crime data, in the possibly vain hope of preventing misleading coverage.
© 2026 University of Cambridge