How have Covid-19 fatalities compared with other causes of death?
Winton Centre for Risk and Evidence Communication
How have Covid-19 fatalities compared with other causes of death?
As Covid slowly turns from a societal threat into a process of risk management, it is important that people have a sense of the risks they have faced, may face in the future, and may pose to others. As with all our work at the Winton Centre, we intend only to inform people, not to persuade them.
But simply quoting numbers of deaths, or death rates per 100,000 people, is not sufficient to inform people of their risk. First because death is only the most extreme negative outcome, and long-term health effects are important - unfortunately statistics are not yet available, and then would need to be compared, for example, to numbers seriously injured on the roads. Second because there is no completely ’neutral’ presentation: every choice of context can make a number look big or small. In this article we compare the numbers of deaths with those from other causes, with the aim of providing a form of context or scale to judge the magnitude of the risks people have faced, and in particular to illustrate the extremely strong dependence on age.
Finally, it's vital to emphasise that although the risk may be very low for most people, clearly we all have responsibility to help protect others, particularly those who are more vulnerable because of age or other factors. Therefore any behavioural choices should reflect both your attitudes to your own risk, and protecting others if you are unknowingly infected. Fortunately, as infection rates go down, both risks become lower.
To give as balanced an impression of the magnitudes of the risks as we can, we first compare Covid deaths with a whole year of other causes. We then scale deaths from other causes proportionally to give an idea of comparable risks over a 16-week period.
We included flu deaths as the most typical infectious respiratory disease, and also accidental deaths that happen unexpectedly, as death from Covid may feel. Suicides and homicides are included to provide some context, but we do not make explicit comparisons with Covid.
Table 1 lists the number of deaths registered with Covid-19 in England and Wales up to 3rd July 2020 in 5-year age bands, and compares with the number of deaths from other causes. Other causes shown include influenza during an average year and during a bad year, deaths from injuries and all accidents, and deaths from road accidents, suicides and homicides. Influenza data are estimates, adjusted to England and Wales’ population and 5-year age bands. See the Appendix for sources of all statistics, and any adjustments done to each cause of death reported.
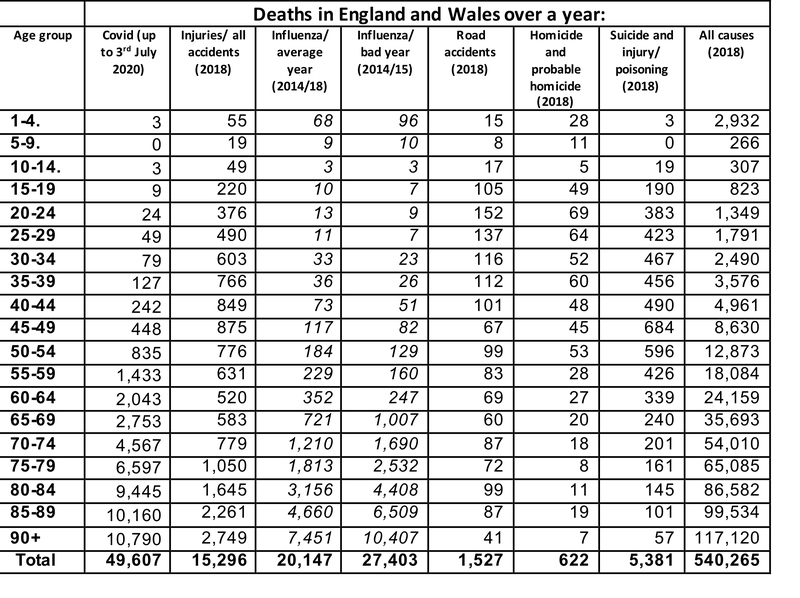
We note the massive increase in the numbers of Covid deaths for increasing age.
Compared with other causes over the whole year:
Note that over 80% of Covid deaths are to those with a pre-existing medical condition. If we conservatively assume that at most 40% off the population have such a condition, then the Covid death rates for people without such a condition are less than a third those reported above (this follows since at least 60% of the people are experiencing at most 20% of the deaths).
There will be some additional Covid deaths over the remainder of 2020, although this is likely to be limited due to additional measures being precipitated by outbreaks.
We now compare with deaths from other causes, scaled to a typical 16 weeks (ie a multiplier of 16/52).
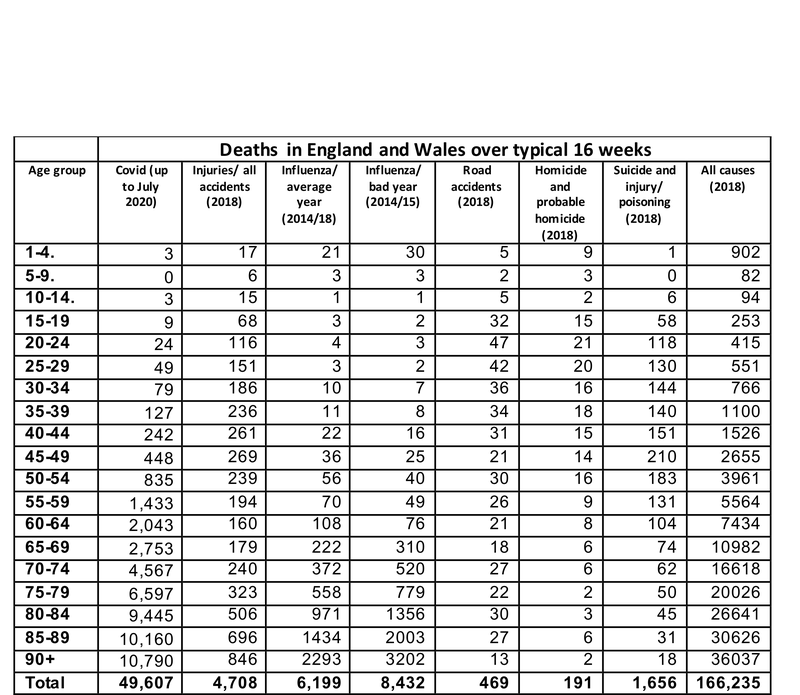
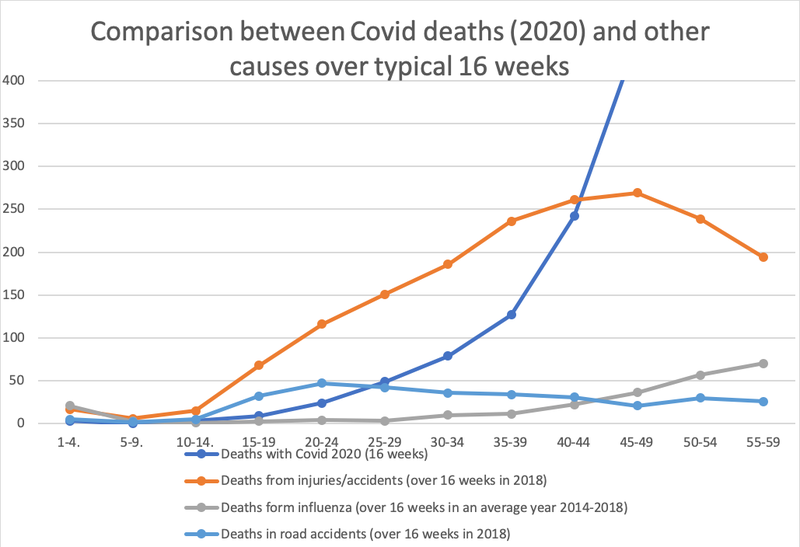
Some conclusions:
Again, Covid death rates for people without a pre-existing medical condition are less than a third those reported above.
Deaths form COVID-19
Covid deaths are given by the weekly bulletins from the Office for National Statistics. This includes 49,607 deaths with Covid on the death certificate, registered up to 3rd July 2020. This total will increase.
Deaths from Influenza in an average year
Data was taken from Public Health England Surveillance of influenza and other respiratory viruses in the UK, winter 2018 to 2019 report (page 51). Since the original data covers England only and comes in wide age-bands (0-4, 5-14, 15-64, 65+ years), it was adjusted to England and Wales’ population and 5-year age-band, by using deaths in 2018 due to influenza and pneumonia (Nomis, LC28) as a reference to redistribute the number of influenza cases. For example, in order to estimate flu deaths in the 55-59 age-group:
Deaths from influenza in a bad year
Calculations were done as above based on 2014/15 numbers, the year with most influenza cases reported from the 2014-2019 period.
Deaths from injuries/all accidents (2018)
Data was taken from Nomis official labour market statistics from the Office for National Statistics (ONS). Data were filtered by England and Wales, 2018, all group ages, gender total, the underlying cause of death: Accidents (LC01). The accidents included are:
- Accidental drowning and submersion (LC01a)
- Accidental falls (LC01b)
- Accidental poisoning (LC01c)
- Accidental threats to breathing (LC01d)
- Land transport accidents (LC01e)
- Non-intentional firearm discharge (LC01f)
As with subsequent data from Nomis, this information is based on England and Wales’s population and deaths are by 5-year bands and so adjustments were not required, except combining the number of cases from the groups ‘under 1 year’ and ‘1-4 years’.
Deaths in road accidents (2018):
Data was taken from Nomis, filtered by England and Wales, 2018, all group ages, gender total, underlying cause of death: Land Transport Accidents (LC01e).
Suicides
Data was taken from Nomis, filtered by England and Wales, 2018, all group ages, gender total, underlying cause of death: Suicide and injury/poisoning of undetermined intent (LC41). The source specifies that Deaths to Suicide and injury/poisoning of undetermined intent includes all ages and will not match ONS publications which exclude deaths under 10 years of age.
Homicides:
Data was taken from Nomis, filtered by England and Wales, 2018, all group ages, gender total, underlying cause of death: Homicide and probable homicide
© 2026 University of Cambridge