skip to primary navigation skip to content

COVID: Trends in death rates by place of death (updated 15th May)

Winton Centre for Risk and Evidence Communication

COVID: Trends in death rates by place of death (updated 15th May)

The figure below shows the total number of deaths registered in England and Wales for each recent week, split into place of death. The increasing COVID deaths are clear, but the increasing non-COVID deaths in care-homes and at home stands out.

total-place.png

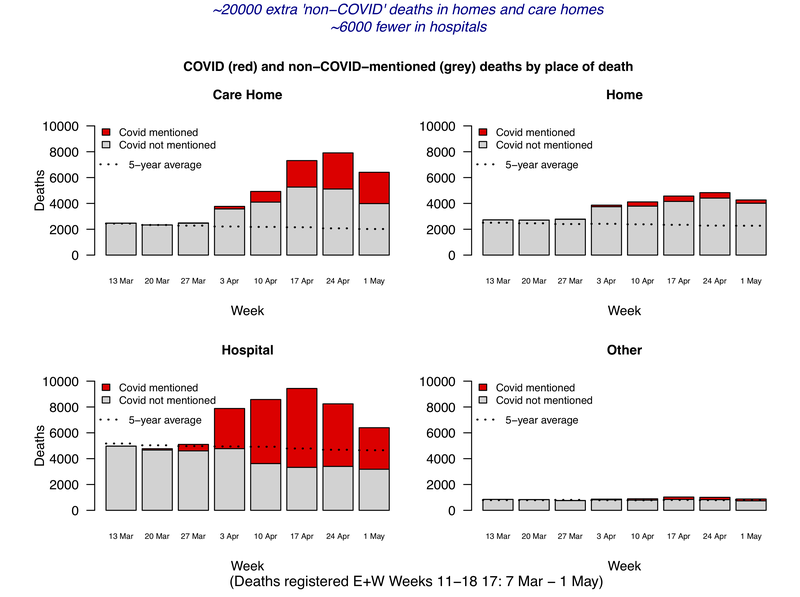
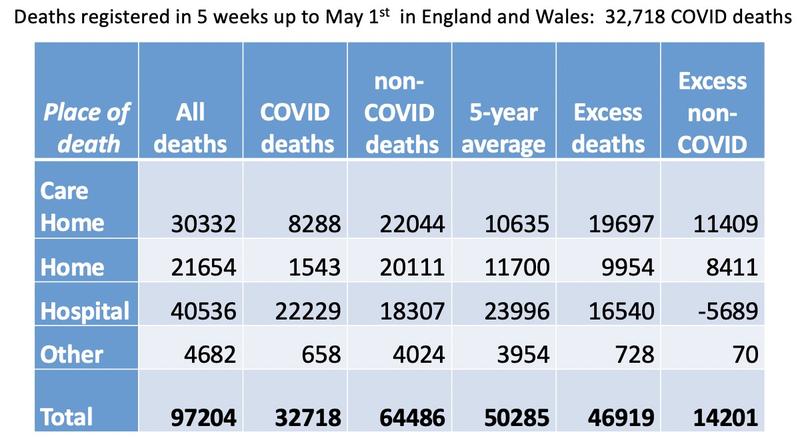
Summary statistics for last 5 weeks are provided in the table below.

table-place.png

In brief -

  • There has been a decline of around 6000 in non-COVID deaths in hospitals, apparently 'exported' to care-homes and homes.
  • Care homes and homes would have expected 22,500 deaths, but experienced 52,000, around 30,000 extra. But only around 10,000 of these have been labelled as COVID.
  • So around 20,000 (11,409 + 8,411 = 19,820) extra non-COVID deaths have been registered in the community over 5 weeks. Around 6,000 (5,689) have been 'exported' from hospitals, but this leaves around 14,000 extra deaths which are essentially unexplained.
  • Some will be under-diagnosis of COVID, but a substantial proportion are presumably 'indirect' deaths due to disruption of the health service.
  • See further analyses of excess deaths.

Data sources