From the latest ONS data we can obtain the total deaths for each sex and age-group, and the number that are labelled as COVID deaths, and compare with five-year averages in the figure below.
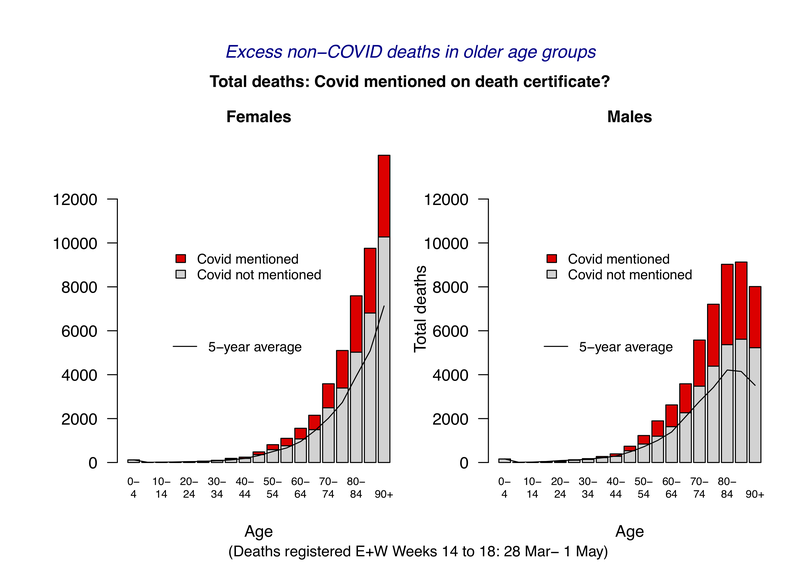
This reveals that
- excess deaths are occurring in all age-groups over 45,
- a substantial proportion of excess non-COVID deaths in the over 70's.
We can expand the graph for ages 45.
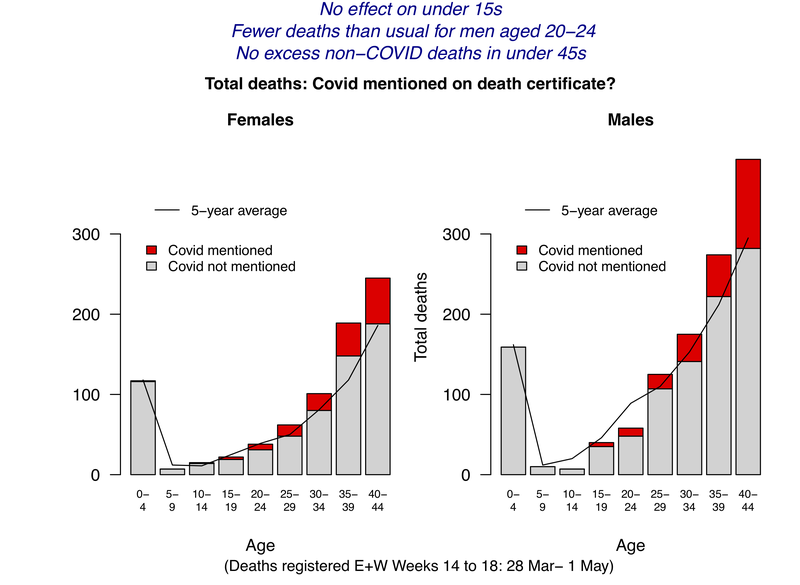
Briefly -
- There is no evidence of excess deaths in the under 15s.
- There has been fewer deaths than expected in young men aged between 20 and 24: 58 deaths compared to the average of 89 over this period over the last 5 years, a 35% reduction from normal [see statistical note below]. If we exclude the 10 COVID deaths in this group, non-COVID deaths have been reduced by 45%. The usual 'lump' in mortality for young men, caused by accidents and other risky behaviours, appears to have been ironed out.
- There is no evidence of excess non-COVID deaths in the under-45s, suggesting they have not had increased risk due to health service disruption.
Just as for COVID deaths, we can examine how the rate of non-COVID excess deaths varies with age and sex.
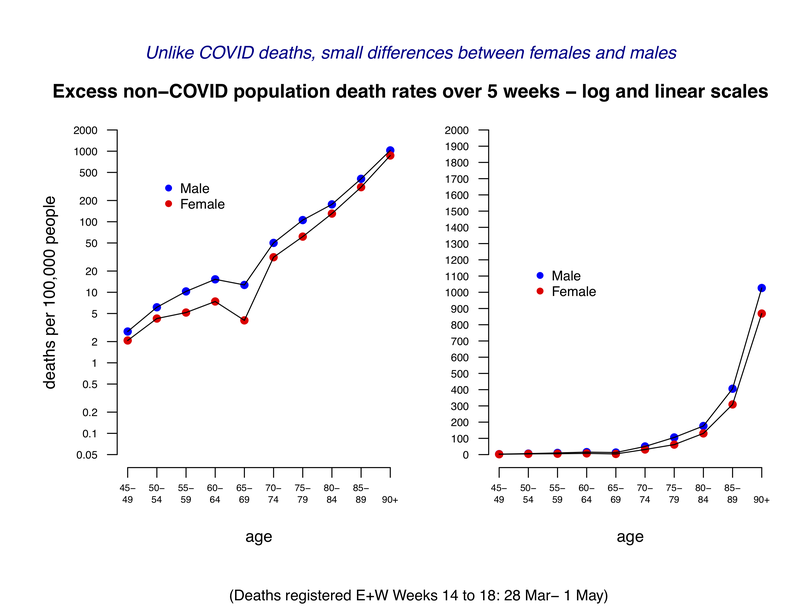
- There is a clear exponential increase with age, but little minimal effect of sex. This is in stark contrast to the doubling of COVID death rates in males.
- If the non-COVID excess deaths were actually COVID-related deaths that were not diagnosed as such, we would expect a similar sex-ratio in non-COVID excess deaths.
- The lack of a strong sex-effect suggests that the non-COVID excess deaths are not primarily due to under-diagnosis.
Statistical note
- Assuming a Poisson distribution with mean 89, the chance of observing such an extreme change in either direction, by chance alone, is 0.0006.
- I am fully aware that I did not pre-specify my hypothesis and therefore this P-value is not strictly valid. However I would claim that this is an obvious group to look at, and therefore it's not entirely wrong.
Data sources