COVID: trends in deaths and excess deaths (Updated 5th June)
Winton Centre for Risk and Evidence Communication
COVID: trends in deaths and excess deaths (Updated 5th June)
We now have data from the Office for National Statistics for death registrations in England and Wales up to the end of May 22nd (Week 21). Recently there has been a steady drop in Covid deaths, with irregularity due to Bank Holidays delaying death registrations.
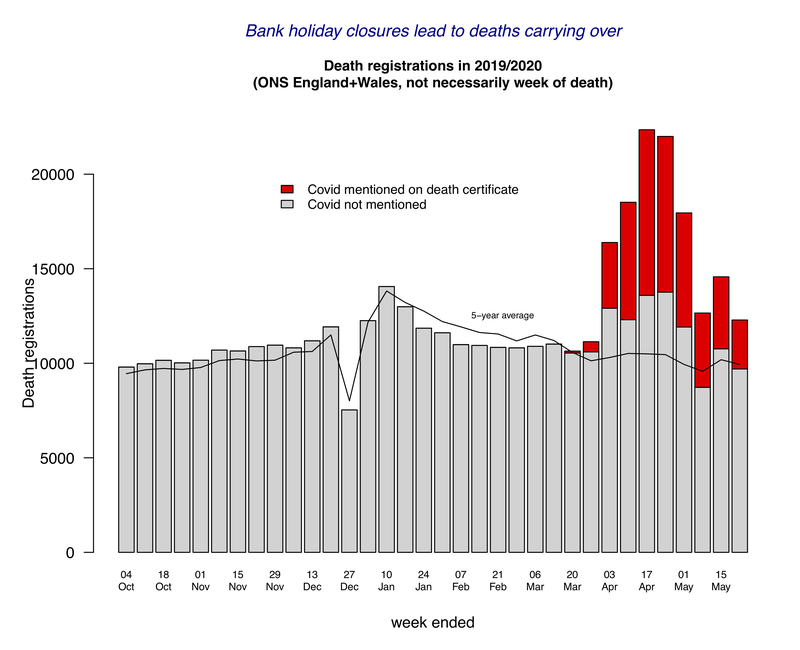
In Week 21, 17,953 deaths were registered , an excess of 8,008 over the five-year average of 9,941. 6,035 of this excess were labeled as COVID, leaving around 2000 (25% of the excess) non-COVID.
Over the 8-week period March 28th to May 22nd, 136,722 deaths were registered, compared to an average 81,425 for these eight weeks over the last five years, an excess of 55,297, corresponding to a relative increase of 68%. 43,047 (31%) of all deaths had COVID mentioned on the death certificate. This means that, of the 55,297 excess deaths, 12,250 (22%) did not have COVID on the death certificate.
The excess deaths are plotted in the Figure below.
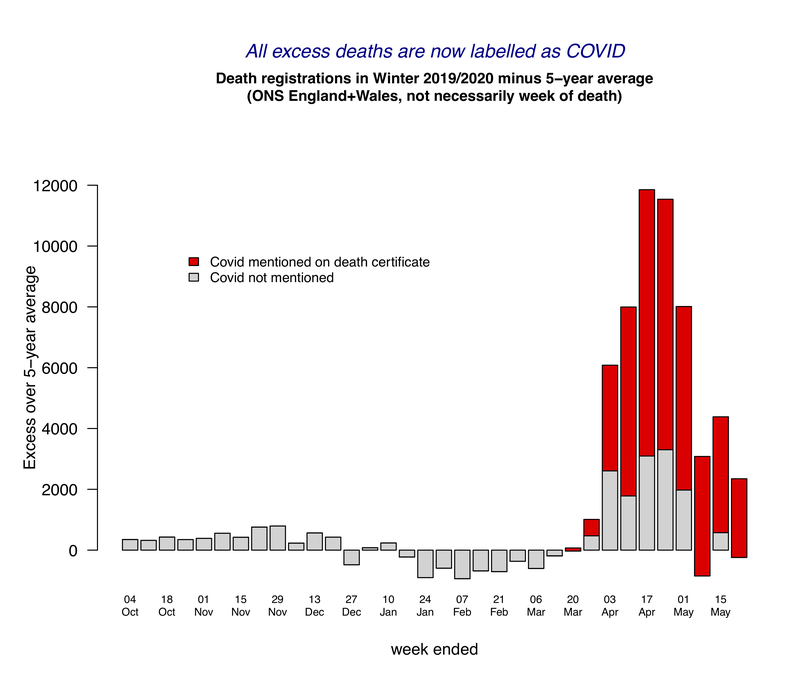
Compared to the five-year average, excess deaths are now comprised solely of Covid-labelled deaths.
Excess deaths that were not labelled as COVID on the death certificate may be due to under-diagnosis, or 'indirect' deaths, say due to collateral damage from the disrupted health service. The current lack of non-Covid excess deaths points towards under-diagnosis as being a major reason for non-Covid deaths in the past.
© 2026 University of Cambridge